The Illusion of Insight: When Infrastructure Dashboards Substitute for Real Observability
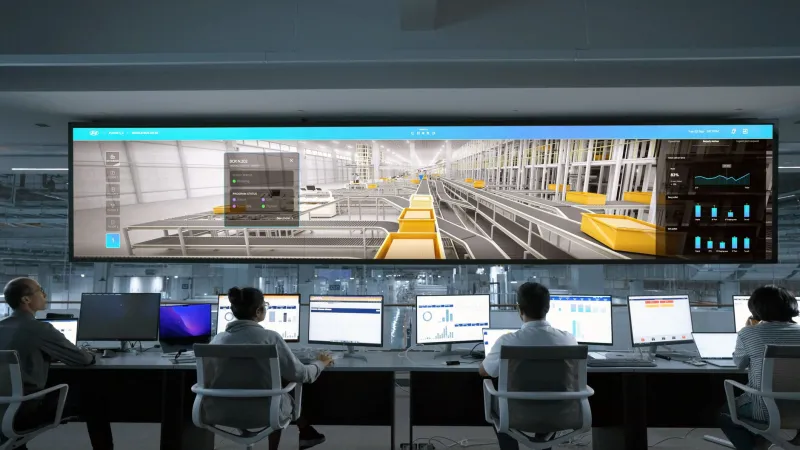
There is a particular kind of confidence that forms in a network operations center when every screen is populated with charts, every metric is trending, and the alert queue sits empty. It feels like understanding. It reads, visually, as control. And in a significant number of cases, it is neither.
The gap between monitoring and observability has been discussed extensively in technical circles, but the behavioral dimension of that gap—the way visually rich dashboards actively suppress the instinct to ask harder questions—receives far less attention than it deserves. This is not a tooling problem, though tooling choices contribute to it. It is an architectural and cultural problem, and it is quietly degrading the operational posture of infrastructure teams across the industry.
Data Volume Is Not the Same as Understanding
Modern observability platforms are exceptionally good at collecting and displaying data. Metrics pipelines ingest millions of time-series data points per minute. Log aggregation systems store terabytes of structured and unstructured event data. Distributed tracing tools capture request flows across dozens of microservices. The raw material for genuine insight has never been more abundant.
Yet abundance creates its own distortions. When every system emits data continuously, the dashboards built to represent that data tend to reflect what is easy to measure rather than what is meaningful to understand. CPU utilization, memory consumption, request rates, and error counts are instrumented by default in most platforms. They populate dashboards automatically. They look authoritative. And for a narrow class of failure modes—resource exhaustion, obvious error spikes, latency outliers—they are genuinely useful.
The problem is the failure modes that do not produce clean signals in those default metrics. Gradual data corruption that does not trigger error rates. Network partitions that cause silent message loss rather than connection failures. Configuration drift across distributed nodes that degrades behavior without generating alerts. Business logic errors that execute successfully at the infrastructure layer while producing incorrect outcomes at the application layer. None of these appear on a standard dashboard. All of them represent real categories of production failure.
The Aesthetic Trap
Dashboard design has become a discipline in its own right, and the results are frequently impressive. Custom visualizations, carefully color-coded status panels, and real-time geographic maps of traffic distribution communicate operational activity in ways that are genuinely engaging. They are also, in some cases, actively misleading.
When a dashboard is optimized for visual clarity and executive presentation, the instrumentation choices that support it tend to favor breadth over depth. A single panel showing aggregate error rates across a service is cleaner than a panel requiring the viewer to understand the difference between client-side and server-side errors, or between errors that are retried transparently and errors that result in data loss. The simpler visualization is easier to build, easier to explain, and far less useful when something goes wrong in a non-obvious way.
This dynamic is particularly acute in hybrid and edge environments, where the infrastructure itself spans multiple administrative domains, connectivity models, and hardware generations. A dashboard built around cloud-native metrics may appear fully populated while providing zero visibility into the behavior of edge nodes operating on intermittent WAN links. The green indicators are accurate for the systems being measured. They say nothing about the systems that are not.
What Genuine Observability Requires
Observability, in its technically rigorous sense, describes the degree to which the internal state of a system can be inferred from its external outputs. A system is observable not because it emits a large volume of data, but because the data it emits is sufficient to answer novel questions—questions that were not anticipated when the instrumentation was designed.
Meeting that standard requires a deliberate instrumentation strategy, not a default one. It requires asking, for each component of the infrastructure, what failure modes are possible that would not produce a signal in the current monitoring configuration. It requires correlating signals across layers—infrastructure metrics, application traces, and business-level outcomes—rather than treating each layer as an independent monitoring domain.
For hybrid environments, it also requires explicit instrumentation of the boundaries between systems. The handoff between a cloud workload and an edge node, the transition between a managed network and a customer-premises device, the point at which a request leaves a monitored environment and enters one that is not: these boundaries are where the most consequential failures tend to occur, and they are systematically underrepresented in standard dashboard configurations.
Structured Questioning as an Operational Practice
One of the more practical shifts an infrastructure team can make is to institutionalize the practice of failure mode enumeration before instrumentation decisions are finalized. For each new service or infrastructure component, the team documents the specific ways it could fail silently—without triggering existing alerts—and then designs instrumentation to detect those modes explicitly.
This is not a novel concept. It draws from practices in reliability engineering and safety-critical systems design that predate modern cloud infrastructure by decades. What is novel is applying it consistently in environments where the default behavior of every platform is to generate dashboards automatically and where the existence of those dashboards creates organizational pressure to treat the instrumentation as complete.
Synthetic monitoring—executing scripted transactions against production systems from external vantage points—is another mechanism that surfaces failure modes invisible to internal metrics. A system that reports healthy internally while failing to respond correctly to external requests is a failure mode that only external probing can reliably detect. In edge environments, where the path from user to service involves multiple network hops and administrative boundaries, synthetic monitoring from representative locations is particularly valuable.
Recalibrating Confidence
The goal is not to distrust monitoring data or to dismiss the value of well-designed dashboards. Visualization tools, used appropriately, accelerate diagnosis and reduce mean time to resolution during active incidents. The goal is to recalibrate the confidence that those tools generate—to recognize that a quiet alert queue means no alert conditions have been triggered, not that no failures are occurring.
Organizations that have made this shift tend to describe it as uncomfortable initially. Acknowledging the limits of existing instrumentation means acknowledging uncertainty, and uncertainty is not a message that infrastructure teams are typically rewarded for communicating upward. But the alternative—maintaining false confidence in a monitoring posture that cannot detect entire categories of failure—carries a cost that eventually presents itself, usually at the worst possible moment.
At S4Core, we hold that genuine infrastructure insight is not a product of data volume or dashboard aesthetics. It is a product of deliberate design, honest enumeration of blind spots, and the organizational willingness to treat uncertainty as information rather than a problem to be papered over with additional charts.